Chapter Seven
Space Perception
We live in a three-dimensional world (actually, four dimensions if time is included). In the short history of visualization research, most graphical display methods have required that data be plotted on sheets of paper, but computers have evolved to the point that this is no longer necessary. Now we can create the illusion of three-dimensional (3D) space behind the monitor screen, changing over time if we wish. The big question is why should we do this? There are clear advantages to conventional two-dimensional (2D) techniques, such as the bar chart and the scatterplot. The most powerful pattern-finding mechanisms of the brain work in 2D, not 3D. Designers already know how to draw diagrams and represent data effectively in two dimensions, and the results can easily be included in books and reports. Of course, one compelling reason for an interest in 3D space perception is the explosive advance in 3D computer graphics. Because it is so inexpensive to display data in an interactive 3D virtual space, people are doing it—often for the wrong reasons. It is inevitable that there is now an abundance of ill-conceived 3D design, just as the advent of desktop publishing brought poor use of typography and the advent of cheap color brought ineffective and often garish use of color. Through an understanding of space perception, we hope to reduce the amount of poor 3D design and clarify those instances in which 3D representation is really useful.
The first half of this chapter presents an overview of the different factors, called depth cues, involved in the perception of 3D space. This will provide the foundation for the second half, which is about how these cues can be effectively applied in design. The way we use spatial information depends greatly on the task at hand. Docking one object with another or trying to trace a path in a tangled web of imaged blood vessels require different ways of seeing. The second half gives a task-based analysis of the ways in which different cues are used in performing seven different tasks, ranging from tracing paths in 3D networks to judging the morphology of surfaces to appreciating an aesthetic impression of spaciousness.
Depth Cue Theory
The visual world provides many different sources of information about 3D space. These sources are usually called depth cues, and a large body of research is related to the way the visual system processes depth cue information to provide an accurate perception of space. Following is a list of the more important depth cues. They are divided into categories according to whether they can be reproduced in a static picture (monocular static) or a moving picture (monocular dynamic) or require two eyes (binocular).
More attention is devoted to stereoscopic depth perception than to the other depth cues, not because it is the most important—it is not—but because it is relatively complex and because it is difficult to use effectively.
Perspective Cues
Figure 7.1 shows how perspective geometry can be described for a particular viewpoint and a picture plane. The position of each feature on the picture plane is determined by extending a ray from the viewpoint to that feature in the environment. If the resulting picture is subsequently scaled up or down, the correct viewpoint is specified by similar triangles, as shown. If the eye is placed at the specified point with respect to the picture, the result is a correct perspective view of the scene. A number of the depth cues are direct results of the geometry of perspective. These are illustrated in Figures 7.2 and 7.3.
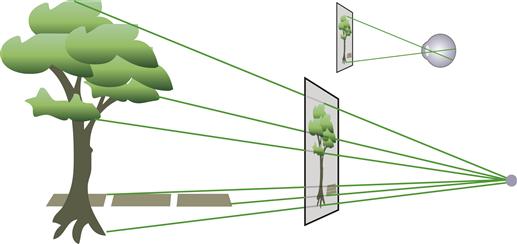
Figure 7.1 The geometry of linear perspective is obtained by sending a ray from each point in the environment through a picture window to a single fixed point. To obtain a perfect perspective picture, each point on the picture window is colored according to the light that emanates from the corresponding region of the environment. The result is that objects vary in size on the picture plane in inverse proportion to their distance from the fixed point. If an image is created according to this principle, the correct viewpoint is determined by similar triangles, as shown in the upper right.
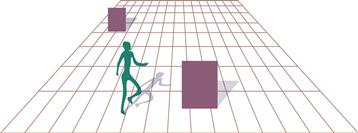
Figure 7.2 Perspective cues arising from perspective geometry include the convergence of lines and the fact that more distant objects become smaller on the picture plane.

Figure 7.3 A texture gradient is produced when a uniformly textured surface is projected onto the picture plane.
• Parallel lines converge to a point.
• Objects at a distance appear smaller on the picture plane than do nearby objects. Objects of known size may have a very powerful role in determining the perceived size of adjacent unknown objects. An image of a person placed in a picture of otherwise abstract objects gives a scale to the entire scene.
• Uniformly textured surfaces result in texture gradients in which the texture elements become smaller with distance.
In terms of the total amount of information available from an information display, there is no evidence that a perspective picture lets us see more than a non-perspective image. A study by Cockburn and McKenzie (2001) showed that perspective cues added no advantage to a version of the Data Mountain display of Robertson et al. (1998). The version shown in Figure 7.4(b) was just as effective as the one in Figure 7.4(a); however, both of these versions make extensive use of other depth cues, occlusion, and height on the picture plane.

Figure 7.4 (a) Variation on the Robertson et al. (1998) Data Mountain display. (Courtesy of Andy Cockburn.) (b) Same as (a) but without perspective.
The Duality of Depth Perception in Pictures
In the real world, we generally perceive the actual size of an object rather than the size at which it appears on a picture plane (or on the retina). This phenomenon is called size constancy. The degree to which size constancy is obtained is a useful measure of the relative effectiveness of depth cues. When we perceive pictures of objects, we enter a kind of dual perception mode. To some extent, we have a choice between accurately judging the size of a depicted object as though it exists in a 3D space and accurately judging its size on the picture plane (Hagen, 1974). The amount and effectiveness of the depth cues used will, to some extent, make it easy to see in one mode or the other. The picture plane sizes of objects in a very sketchy schematic picture are easy to perceive. At the other extreme, when viewing a highly realistic stereoscopic moving picture at a movie theater, the 3D sizes of objects will be more readily perceived, but in this case large errors will be made in estimating picture plane sizes. Figure 7.5 shows how perspective cues can affect the perceived size of two objects that have identical sizes on the picture plane. This has implications if accurate size judgments are required in a visualization.
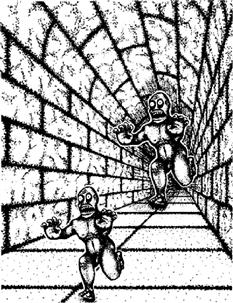
Figure 7.5 Because of the strong perspective cues the figure above looks much bigger than the one below, even though they are the same size. This would be even more pronounced with greater realism and stereoscopic cues. In the image plane the two figures are identical. From http://www.sapdesignguild.org/contact.asp. (With permission).
[G7.1] If accurate size judgments are required for abstract 3D shapes viewed in a computer-generated 3D scene, provide the best possible set of depth cues.
Pictures Seen from the Wrong Viewpoint
It is obvious that most pictures are not viewed from their correct centers of perspective. In a movie theater, only one person can occupy this optimal viewpoint (determined by viewpoint position, the focal length of the original camera, and the scale of the final picture). When a picture is viewed from somewhere other than the center of perspective, the laws of geometry suggest that significant distortions should occur. Figure 7.6 illustrates this. When the mesh shown in Figure 7.6 is projected on a screen with a geometry based on viewpoint (a), but actually viewed from position (b), it should be perceived to stretch along the line of sight as shown. However, although people report seeing some distortion at the start of looking at moving pictures from the wrong viewpoint, they become unaware of the distortion after a few minutes. Kubovy (1986) calls this the robustness of linear perspective. Apparently, the human visual system overrides some aspects of perspective in constructing the 3D world that we perceive.
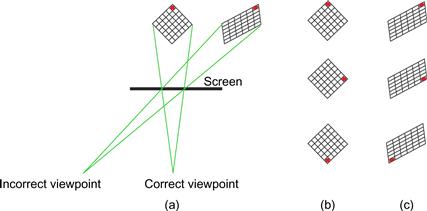
Figure 7.6 (a) When a perspective picture is seen from the wrong viewpoint, simple geometry predicts that large distortions should be seen. In fact, they are not seen or, when seen, are minimal. (b) A rotating object seen from the incorrect viewpoint appears undistorted. (c) Were the mental calculation based on simple geometry, it should appear to warp as shown in the top-to-bottom sequence.
One of the mechanisms that can account for this lack of perceived distortion may be a built-in perceptual assumption that objects in the world are rigid. Suppose that the mesh in Figure 7.6 is smoothly rotated around a vertical axis and projected assuming the correct viewpoint, but viewed from an incorrect viewpoint. It should appear as a nonrigid, elastic body, but perceptual processing is constrained by a rigidity assumption, and this causes us to see a stable, nonelastic 3D object.
Under extreme conditions, some distortion is still seen with off-axis viewing of moving pictures. Hagen and Elliott (1976) showed that this residual distortion is reduced if the projective geometry is made more parallel. This can be done by simulating long-focal-length lenses, which may be a useful technique if displays are intended for off-axis viewing.
[G7.2] To minimize perceived distortions from off-axis viewing of 3D data spaces, avoid extremely wide viewing angles when defining perspective views. As a rule of thumb, keep the horizontal viewing angle below 30 degrees.
Various technologies exist that can track a user’s head position with respect to a computer screen and thereby estimate the position of the eye(s). With this information, a 3D scene can be computed and viewed so the perspective is “correct” at all times by adjusting the viewpoint parameters in the computer graphics software (Deering, 1992). I called this setup fish-tank virtual reality to contrast it with the immersive virtual reality that is obtained with head-mounted displays (Ware et al., 1993). It is like having a small, bounded, fish-tank-sized artificial environment with which to work. There are two reasons why this might be desirable, despite the fact that incorrect perspective viewing of a picture seems generally unimportant. The first reason is that, as an observer changes position, the perspective image will change accordingly, resulting in motion parallax. Motion parallax is itself a depth cue, as discussed later in the structure-from-motion section. The second reason is that in some virtual-reality systems it is possible to place the subject’s hand in the same space as the virtual computer graphics imagery. Figure 7.7 shows an apparatus that uses a half-silvered mirror to combine computer graphics imagery with a view of the user’s own hand. To get the registration between the hand and virtual objects correct, the eye position must be tracked and the perspective computed accordingly.
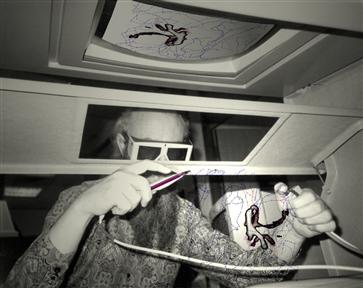
Figure 7.7 A user is attempting to trace 3D blood vessels in an interface that puts his hands in the same space as the virtual computer graphics imagery. From Serra et al. (1997). Reproduced with permission.
When virtual-reality head-mounted displays are used, it is essential that the perspective be coupled to a user’s head movement, because the whole point is to allow users to change viewpoint in a natural way. Experimental evidence supports the idea that head-coupled perspective enhances the sense of presence in virtual spaces more than stereoscopic viewing (Arthur et al., 1993; Pausch et al., 1996).
Occlusion
If one object overlaps or occludes another, it appears closer to the observer (see Figure 7.8). This is probably the strongest depth cue, overriding all the others, but it provides only binary information. An object is either behind or in front of another; no information is given about the distance between them. A kind of partial occlusion occurs when one object is transparent or translucent. In this case, there is a color difference between the parts of an object that lie behind the transparent plane and the parts that are in front of it.

Figure 7.8 The figures depicted on the left can be seen as having the same size but different distances. On the right, the occlusion depth cue ensures that we see the upper figure as at the same depth or closer than the left figure. It therefore appears smaller.
Occlusion can be useful in design; for example, the tabbed cards illustrated in Figure 7.9(a) use occlusion to provide rank-order information, in addition to rapid access to individual cards. Although modern graphical user interfaces (GUIs) are usually described as being 2D, they are actually 3D in a nontrivial way. Overlapping windows rely on our understanding of occlusion to be effective; see Figure 7.9(b).
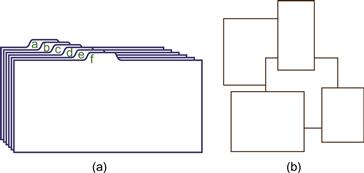
Figure 7.9 (a) Careful use of occlusion enables small tabs to provide access to larger objects. (b) Window interfaces use occlusion.
Shape-from-Shading
Continuous surfaces are common in 3D visualization, and the shape of their bumps, ridges, and indentations can contain important information. Examples include digital elevation maps representing the topography of the land or the ocean floor; maps of physical properties of the environment, such as pressure and temperature; and maps representing mathematical functions that are only distantly related to the raw data. These kinds of data objects are variously called 2D scalar fields, univariate maps, or 2D manifolds. The two traditional methods for displaying scalar field information are the contour map, which originated in cartography, and the pseudocolor map, discussed in Chapter 4. Here we consider using the spatial cues that let us perceive curved surfaces in the world, mainly shape-from-shading and conformal texture.
Shading Models
The basic shading model used in computer graphics to represent the interaction of light with surfaces has already been discussed in Chapter 2. It has four basic components, as follows:
1. Lambertian shading—Light reflected from a surface equally in all directions
2. Specular shading—Highlights reflected from a glossy surface
3. Ambient shading—Light coming from the surrounding environment
4. Cast shadows—Shadows cast by an object, either on itself or on other objects
Figure 7.10 illustrates the shading model, complete with cast shadows, applied to a digital elevation map of San Francisco Bay. As can be seen, even this simple lighting model is capable of producing a dramatic image of surface topography. A key question in choosing a shading model for data visualization is not its degree of realism but how well it reveals the surface shape. There is some evidence that more sophisticated lighting may actually be harmful in representing surfaces.
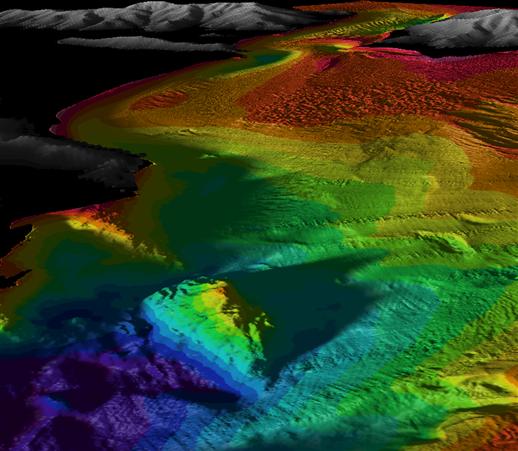
Figure 7.10 A shaded representation of the floor of San Francisco Bay, shown as if the water had been drained out of it. Data courtesy of James Gardner, U.S. Geological Survey. Image constructed using IVS Fledermaus software.
Experiments by Ramachandran (1988) suggest that the brain assumes a single light source from above in determining whether a particular shaded area is a bump or a hollow (see Figure 7.11). The kinds of complex shadows that result from multiple light sources and radiosity modeling may be visually confusing rather than helpful. As discussed in Chapter 2 (Figure 2.8) specular highlights can be extremely useful in revealing fine surface details, as when a light is used to show scratches on glass. At other times, highlights will obscure patterns of surface color.
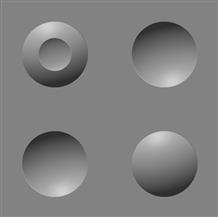
Figure 7.11 The brain generally assumes that lighting comes from above. The bumps in this image become hollows when the picture is turned upside down, and vice versa.
A clever use of shape-from-shading is shown in Figure 7.12. van Wijk and Telea (2001) developed a method that allows for the perception of surface shape using shape-from-shading information. In addition, they added ridges that also allow for contours to be perceived.
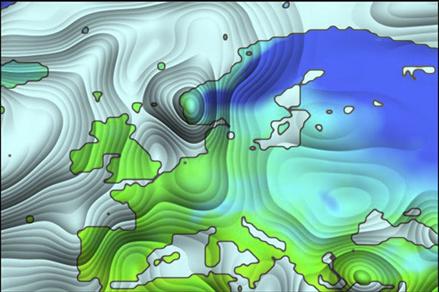
Figure 7.12 In this image, the average precipitation over Europe for January has been converted to a smoothed surface using the method of van Wijk and Telea (2001). The shape of this surface is revealed through shape-from-shading information.
Shading information can also be useful in emphasizing the affordances of display widgets such as buttons and sliders, even in displays that are very flat. Figure 7.13 illustrates a slider enhanced with shading. This technique is widely used in today’s graphical user interfaces.

Figure 7.13 Even with mostly 2D interfaces, subtle shading can make sliders and other widgets look like objects that can be manipulated.
Cushion Maps
The treemap visualization technique was introduced in Chapter 6 and illustrated in Figure 6.59 (Johnson & Shneiderman, 1991). As discussed, a problem with treemaps is that they do not convey tree structure well, although they are extremely good at showing the sizes and groupings of the leaf nodes. An interesting solution devised by van Wijk and van de Wetering (1999) makes use of shading. They called it a cushion map. To create it, the hierarchical shading model is applied to a treemap in such a way that areas representing large branches are given an overall shading, and regions representing smaller branches are given their own shading within the overall shading. This is repeated down to the leaf nodes, which have the smallest scale shading. An example is shown in Figure 7.27 showing a computer file system. As can be seen, the hierarchical structure of the system is more visible than it would be in an unshaded treemap.
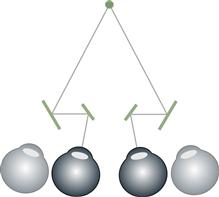
Figure 7.27 A telestereoscope is a device that uses mirrors or prisms to increase the effective eye separation, thereby increasing stereoscopic depth information (disparities).
Surface Texture
Surfaces in nature are generally textured. Gibson (1986) took the position that surface texture is an essential property of a surface. A nontextured surface, he said, is merely a patch of light. The way in which textures wrap around surfaces can provide valuable information about surface shape.
Without texture, it is usually impossible to distinguish one transparent curved surface from another transparent curved surface lying beneath it. Figure 7.15 shows an illustration from Interrante et al. (1997) containing experimental see-through textures designed to reveal one curved surface lying above another. The concept of laciness, discussed in Chapter 6, is relevant here, because it tells us something about how to make layers visually distinct and thereby clearly show separate surfaces, one beneath another.
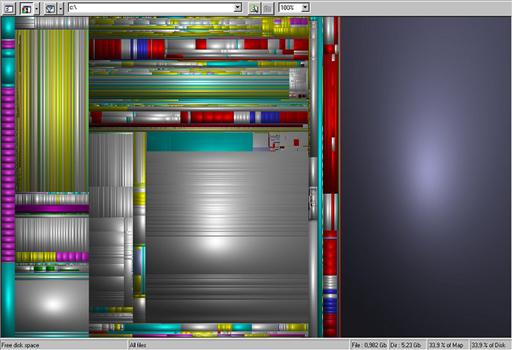
Figure 7.14 The cushion map is a variation of a treemap that uses shape-from-shading information to reveal hierarchical structure. Courtesy of Jack van Wijke.
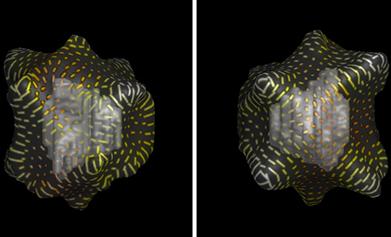
Figure 7.15 Textures designed to reveal surface shape so another surface can be seen beneath. From Interrante et al. (1997). Reproduced with permission.
There are many ways to make oriented textures conform to a surface. Texture lines can be constructed to follow the fall line (down slope), to be horizontal contours, to be at right angles to maximum curvature direction, or to be orthogonal to the line of site of a viewer, to present just a few examples.
Kim et al. (2003) investigated combinations of first and second principal directions of curvature contours, as illustrated in Figure 7.16 (the principal curvature direction is the direction of maximum curvature). All of the textured surfaces were artificially lit using standard computer graphics shading algorithms. Subjects made smaller errors in surface orientation judgments when two contour directions were used to form a mesh, as shown in Figure 7.16(a). Nevertheless, this study and Norman et al. (1995) found that errors averaged 20 degrees. This is surprisingly large and suggests that further gains are possible.
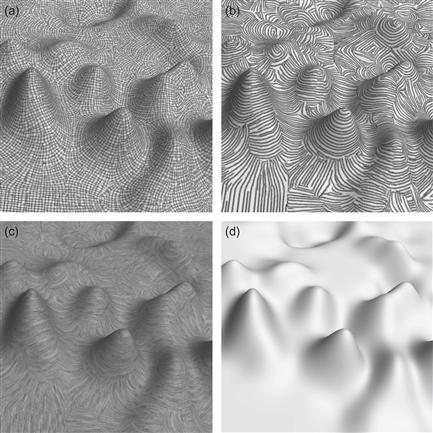
Figure 7.16 Surface-revealing texture patterns. (a) Two-directional texture pattern following first and second principal directions. (b) One-directional texture pattern following first principal curvature direction. (c) One-directional, line-integral convolutions texture following first principal curvature direction. (d) No texture. From Kim et al. (2003. Reproduced with permission.
A simpler way of a revealing the shape of a surface through texture is to drape a regular grid mesh over it (Sweet & Ware, 2004; Bair et al. 2009). See Figure 7.17. More studies are needed to do direct comparisons between the various conformal texture generation methods, but cross-paper comparisons suggest that simple draped meshes yield smaller errors than the fall line or principal curvature textures, as Bair et al. (2009) measured mean errors of less than 12 degrees using grids. In addition, if grids are constructed with a standard cell size they provide useful scale information. Another interesting result is that perspective views result in smaller errors than plan views.

Figure 7.17 Simple draped grids can help reveal surface shape.
[G7.3] In 3D visualizations of height field data, consider using draped grids to enhance surface shape information. This is likely to be most useful where the data varies smoothly so surface shape features are substantially larger than grid squares.
Cast Shadows
Cast shadows are a very potent cue to the height of an object above a plane, as illustrated in Figure 7.18. They can function as a kind of indirect depth cue—the shadow locates the object with respect to some surface in the environment. In the case of Figure 7.18, this surface is not present in the illustration but is assumed by the brain. In a multifactor experiment, Wanger et al., (1992) found that shadows provided the strongest depth cue when compared to texture, projection type, frames of reference, and motion. It should be noted, however, that they used an oblique checkerboard as a base plane to provide the actual distance information, so strictly speaking the checkerboard was providing the depth cue. Cast shadows function best as a cue to height above surface when there is a relatively small distance between the object and the surface. They can be especially effective in showing when an object is very close to the point of contact (Madison et al., 2001).
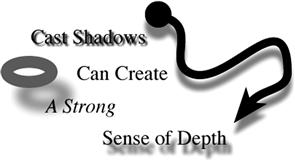
Figure 7.18 Cast shadows can be useful in making data appear to stand above an opaque plane.
Kersten et al. (1997) showed that cast shadows are especially powerful when objects are in motion. One of their demonstrations is illustrated in Figure 7.19(b). In this case, the apparent trajectory of a ball moving in 3D space is caused to change dramatically depending on the path of the object’s shadow. The image of the ball actually travels in a straight line, but the ball appears to bounce because of the way the shadow moves. In this study, shadow motion was shown to be a stronger depth cue than change in size with perspective.
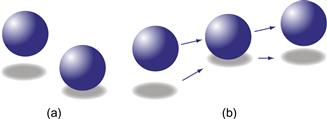
Figure 7.19 (a) Shadows can provide a strong cue for the relative height of objects above a plane. (b) The effect is even stronger with motion. The ball actually appears to bounce when the ball and shadows are animated to follow the trajectories shown by the arrows.
It has been shown that shadows can be correctly interpreted without being realistic. Kersten et al., (1996) found no effect of shadow quality in their results; however, one of the principal cues in distinguishing shadows from non-shadows in the environment is the lack of sharpness in shadow edges. Fuzzy-edged shadows are likely to lead to less confusing images.
Cast shadows are useful in distinguishing information that is layered a small distance above a planar surface, as illustrated in Figure 7.18. In this case, they are functioning as a depth cue. This technique can be applied to layered map displays of the type used in geographical information systems (GISs).
In complex environments, however, where objects are arranged throughout 3D space, cast shadows can be confusing rather than helpful, because it may not be possible to determine perceptually which object is casting a particular shadow.
[G7.4] In 3D data visualizations, consider using cast shadows to tie objects to a surface that defines depth. The surface should provide strong depth cues, such as a grid texture. Only use cast shadows to aid in depth perception where the surface is simple and where the objects casting the shadow are close to it.
Distance Based on Familiar Size
Many objects that we see have a known size and this can be used to help us judge distance. Figure 7.20 illustrates this. The German shepherd dog and the chair are objects known to be of roughly comparable size; therefore, we see them as at the same distance in the composition on the left. A different interpretation is available on the right, where the size and vertical position depth cues are consistent with the result that the dog is seen as more distant than the chair.
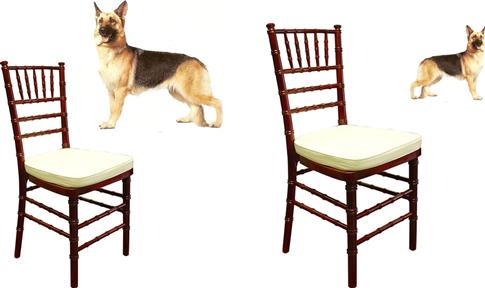
Figure 7.20 On the left, we see a picture of a dog and a chair, arranged rather arbitrarily but appearing to be the same distance from the viewer. On the right, the known sizes of dog and chair are consistent with another interpretation, that of a coherent 3D scene with the dog at a greater distance.
Depth of Focus
When we look around, our eyes change focus to bring the images of fixated objects into sharp focus on the fovea. As a result, the images of both nearby and more distant objects become blurred, making blur an ambiguous depth cue. In an image with some objects that are sharp and others that are blurred, all the sharp objects tend to be seen at a single distance, and the blurred objects tend to be seen at a different distance, either closer or farther away. Focus effects are important in separating foreground objects from background objects, as shown in Figure 7.21. Perhaps because of its role as a depth cue, simulating depth of focus is an excellent way to highlight information by blurring everything except that which is critical. Of course, this only makes sense if the critical information can be reliably predicted.

Figure 7.21 The eye adjusts to bring objects of interest into sharp focus. As a result, objects that are closer or more distant become blurred.
The effect of depth of focus can be properly computed only if the object of fixation can be predicted. In normal vision, our attention shifts and our eyes refocus dynamically depending on the distance of the object fixated. Chapter 2 describes a system designed to change focus information based on a measured point of fixation in a virtual environment.
Eye Accommodation
The eye changes focus to bring attended objects into sharp focus on the retina. If the brain could measure the eye’s accommodation this might be a depth cue. But, because we are only capable of focusing to one-half of a diopter, theoretically accommodation can provide only limited information about the distance to objects closer than 2 meters (Hochberg, 1971). In fact, accommodation does not appear to be used to judge distance directly but may be used indirectly in computing the sizes of nearby objects (Wallach & Floor, 1971).
Structure-from-Motion
When an object is in motion or when we ourselves move through the environment, the result is a dynamically changing pattern of light on the retina. Structure-from-motion information is generally divided into two different classes: motion parallax and kinetic depth effect. An example of motion parallax occurs when we look sideways out of a car or train window. Things nearby appear to be moving very rapidly, whereas objects close to the horizon appear to move gradually. Overall, there is a velocity gradient, as illustrated in Figure 7.22(a).

Figure 7.22 Three different kinds of structure-from-motion information. (a) The velocity gradient that results when the viewer is looking sideways out of a moving vehicle. (b) The velocity field that results when the viewer is moving forward through the environment. (c) The kinetic depth information that results when a rotating rigid object is projected onto a screen.
When we move forward through a cluttered environment, the result is a very different expanding pattern of motion, like that shown in Figure 7.22(b). Wann et al. (1995) showed that subjects were able to control their headings with an accuracy of 1 to 2 degrees when they were given feedback from a wide-screen field of dots through which they had to steer. There is also evidence for specialized neural mechanisms sensitive to the time to contact with a visual surface that is being approached. This is inversely proportional to the rate of optical expansion of the pattern of surface features (Lee & Young, 1985), a variable called tau.
The kinetic depth effect can be demonstrated with a wire bent into a complex 3D shape and projected onto a screen, as shown in Figure 7.22(c). Casting the shadow of the wire will suffice for the projection. The result is a two-dimensional line, but if the wire is rotated, the three-dimensional shape of the wire immediately becomes apparent (Wallach & O’Connell, 1953). The kinetic depth effect dramatically illustrates a key concept in understanding space perception. The brain generally assumes that objects are rigid in 3D space, and the mechanisms of object perception incorporate this constraint. The moving shadow of the rotating bent wire is perceived as a rigid 3D object, not as a wiggling 2D line. It is easy to simulate this in a computer graphics system by creating an irregular line, rotating it about a vertical axis, and displaying it using standard graphics techniques. Visualizations where many small discrete objects are arranged in space as well as 3D node–link structures can become much clearer with kinetic depth. Structure-from-motion is one reason for the effectiveness of fly-through animated movies that take an observer through a data space.
An obvious problem when using kinetic depth in data visualization is that people often wish to contemplate a structure from a particular viewpoint; rotating it causes the viewpoint to be continuously changed. This can be mitigated by having the scene rotate about a vertical axis. If the rotation is oscillatory, then the viewpoint can be approximately preserved.
[G7.5] To help users understand depth relationships in 3D data visualizations, consider using structure-from-motion by rotating the scene around the center of interest. This is especially useful when objects are unattached to other parts of the scene.
Eye Convergence
When we fixate an object with both eyes, the eyes converge to a degree dictated by the distance of the object. This vergence angle is illustrated in Figure 7.23. Given the two line-of-sight vectors, it is a matter of simple trigonometry to determine the distance to the fixated object; however, the evidence suggests that the human brain is not good at this geometric computation except for objects within arm’s length (Viguier et al. 2001). The vergence sensing system appears capable of quite rapid recalibration in the presence of other spatial information (Fisher & Cuiffreda, 1990).

Figure 7.23 The vergence angle θ varies as the eyes fixate on near and far objects.
Stereoscopic Depth
Stereoscopic depth is information about distance provided by the slight differences in images on the retinas of animals with two forward-looking eyes. Stereoscopic displays simulate these differences by presenting different images to the left and right eyes of viewers. There is an often expressed opinion that stereoscopic displays allow “truly” 3D images. In advertising literature, potential buyers are urged to buy stereoscopic display equipment and “see it in 3D.” As should be plain from this chapter, stereoscopic disparity is only one of many depth cues that the brain uses to analyze 3D space, and it is by no means the most useful one. If fact, as much as 20% of the population may be stereo blind, yet they function perfectly well and are often unaware that they have a disability. Nevertheless, stereoscopic displays can provide a particularly compelling sense of a 3D virtual space, and for a few tasks they can be extremely useful.
The basis of stereoscopic depth perception is forward-facing eyes with overlapping visual fields. On average, human eyes are separated by about 6.4 centimeters; this means that the brain receives slightly different images, which can be used to compute relative distances of pairs of objects. Stereoscopic depth is a technical subject, and we therefore begin by defining some of the terms.
Figure 7.24 illustrates a simple stereo display. Both eyes are fixated on the vertical line (a for the right eye, c for the left eye). A second line, d, in the left eye’s image is fused with b in the right eye’s image. The brain resolves the discrepancy in line spacing by perceiving the lines as being at different depths, as shown.
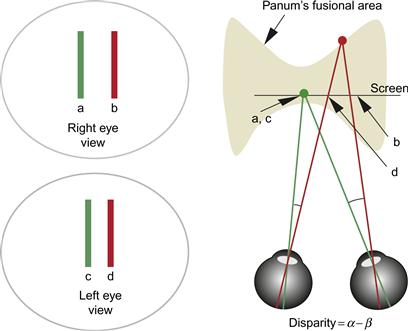
Figure 7.24 A simple stereo display. Different images for the two eyes are shown on the left. On the right, a top-down view shows how the brain interprets this display. The vertical lines a and b in the right-eye image are perceptually fused with c and d, respectively, in the left-eye image.
Angular disparity is the difference between the angular separation of a pair of points imaged by the two eyes (disparity = α – β). Screen disparity is the distance between parts of an image on the screen (disparity = [c – d] – [a – b]).
If the disparity between the two images becomes too great, double vision (called diplopia) occurs. Diplopia is the appearance of the doubling of part of a stereo image when the visual system fails to fuse the images. The 3D area within which objects can be fused and seen without double images is called Panum’s fusional area. In the worst case, Panum’s fusional area has remarkably little depth. At the fovea, the maximum disparity before fusion breaks down is only 1/10 degree, whereas at 6 degrees of eccentricity (of the retinal image from the fovea), the limit is 1/3 degree (Patterson & Martin, 1992). The reason why only small disparities can be handled is that disparity-detecting neurons in V1 are only capable of responding to small localized differences between the images from the two eyes (Qian & Zhu, 1997).
Stereopsis is a superacuity. We can resolve disparities of only 10 seconds of arc at better than chance. This means that under optimal viewing conditions we should be able to see a depth difference between an object at 1 kilometer and an object at infinity.
It is worthwhile to consider what these numbers imply for monitor-based stereo displays. A screen with 30 pixels per centimeter, viewed at 57 centimeters, will have 30 pixels per degree of visual angle. The 1/10 degree limit on the visual angle before diplopia occurs translates into about 3 pixels of screen disparity. This means that we can only display 3 whole-pixel-depth steps before diplopia occurs, either in front of or behind the screen, in the worst case. It also means it will only be possible to view a virtual image that extends in depth a fraction of a centimeter from the screen (assuming an object on the screen is fixated). But, it is important to emphasize that this is a worst-case scenario. It is likely that antialiased images will allow better than pixel resolution, for exactly the same reason that vernier acuities can be achieved to better than pixel resolution (discussed in Chapter 2). In addition, the size of Panum’s fusional area is highly dependent on a number of visual display parameters, such as the exposure duration of the images and the size of the targets. Moving targets, simulated depth of focus, and greater lateral separation of the image components all increase the size of the fusional area (Patterson & Martin, 1992). Depth judgments based on disparity can also be made outside the fusional area, although these are less accurate.
Problems with Stereoscopic Displays
It is common for users of 3D visualization systems with stereoscopic display capabilities to disable stereo viewing once the novelty has worn off. There are a number of reasons why stereoscopic displays are disliked. Double-imaging problems tend to be much worse in stereoscopic computer displays than in normal viewing of the 3D environment. One of the principal reasons for this is that in the real world objects farther away than the one fixated are out of focus on the retina. Because we can fuse blurred images more easily than sharply focused images, this reduces diplopia problems in the real world. In addition, focus is linked to attention and foveal fixation. In the real world, double images of nonattended peripheral objects generally will not be noticed. Unfortunately, in present-day computer graphics systems, particularly those that allow for real-time interaction, depth of focus is rarely simulated. All parts of the computer graphics image are therefore equally in focus, even though some parts of the image may have large disparities. Thus, the double images that occur in stereoscopic computer graphics displays are very obtrusive unless depth of focus is simulated.
Frame Cancellation
Valyus (1966) coined the phrase frame cancellation to describe a common problem with stereoscopic displays. If the stereoscopic depth cues are such that a virtual image should appear in front of the screen, the edge of the screen appears to occlude the virtual object, as shown in Figure 7.25. Occlusion overrides the stereo depth information, and the depth effect collapses. This is typically accompanied by a double image of the object that should appear in front.
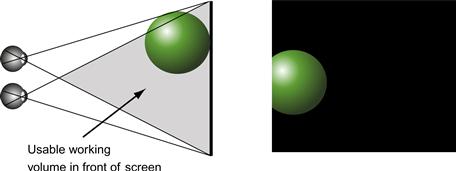
Figure 7.25 Frame cancellation occurs when stereoscopic disparity cues indicate that an object is in front of the monitor screen. Because the edge of the screen clips the object, this acts as an occlusion depth cue and the object appears to be behind the window, canceling the stereo depth effect. Because of this, the usable working volume of a stereoscopic display is restricted as shown.
[G7.6] When creating stereoscopic images, avoid placing graphical objects so that they appear in front of the screen and are clipped by the edges of the screen. The simplest way of doing this is to ensure that no objects are in front of the screen in terms of their stereoscopic depth.
The Vergence–Focus Problem
When we change our fixation between objects placed at different distances, two things happen: The convergence of the eyes changes (vergence), and the focal lengths of the lenses in the eyes accommodate to bring the new object into focus. The vergence and the focus mechanisms are coupled in the human visual system. If one eye is covered, the vergence and the focus of the covered eye change as the uncovered eye accommodates objects at different distances; this illustrates vergence being driven by focus. The converse also occurs—a change in vergence can drive a change in focus.
In a stereoscopic display, all objects lie in the same focal plane, regardless of their apparent depth; however, accurate disparity and vergence information may fool the brain into perceiving them at different depths. Screen-based stereo displays provide disparity and vergence information, but no focus information. The failure to present focus information correctly, coupled with vergence, may cause a form of eyestrain (Wann et al., 1995; Mon-Williams & Wann, 1998).
This problem is present in both stereoscopic head-mounted systems and monitor-based stereo displays. Wann et al. (1995) concluded that vergence and focus cross-coupling “prevents large depth intervals of three-dimensional visual space being rendered with integrity through dual two-dimensional displays.” This may account for the common reports of eyestrain occurring with dynamic stereoscopic displays. It is also worth noting that, because people lose the ability to refocus their eyes as they get older, this particular problem should decline with age.
Distant Objects
The problems with stereoscopic viewing are not always related to disparities that are too large. Sometimes disparities may be too small. The stereoscopic depth cue is most useful at 30 meters or less from the viewer. Beyond this, disparities tend to be too small to be resolved, except under optimal viewing conditions. For practical purposes, most useful stereoscopic depth is obtained within distances of less than 10 meters from the viewer and may be optimal for objects held roughly at arm’s length.
Making Effective Stereoscopic Displays
Because stereoscopic depth perception is a superacuity, the ideal stereoscopic display should have very high resolution, much higher than the typical desktop monitor. On current monitors, the fine detail is produced by pixels, and in a stereoscopic display the pixilation of features such as fine lines will generate false binocular correspondences. High-resolution displays enable the presentation of fine texture gradients and hence disparity gradients that are the basis for stereoscopic surface shape perception.
[G7.7] When creating stereoscopic displays for 3D visualizations, use the highest possible screen resolution, especially in a horizontal direction, and aim to achieve excellent spatial and temporal antialiasing.
There are also ways of mitigating the diplopia, frame cancellation, and vergence–focus problems described previously, although they will not be fully solved until displays that can truly simulate depth become commercially viable. All the solutions involve reducing screen disparities by artificially bringing the computer graphics imagery into the fusional area. Valyus (1966) found that the diplopia problems were acceptable if no more than 1.6 degrees of disparity existed in the display. Based on this, he proposed that the screen disparity should be less than 0.03 times the distance to the screen; however, this provides only about ±1.5 centimeters of useful depth at normal viewing distances. Using a more relaxed criterion, Williams and Parrish (1990) concluded that a practical viewing volume falls between –25% and +60% of the viewer-to-screen distance. This provides a more usable working space.
One obvious solution to the problems involved in creating useful stereoscopic displays is simply to create small virtual scenes that do not extend much in front of or behind the screen. In many situations, though, this is not practical—for example, when we wish to make a stereoscopic view of extensive terrain. A more general solution is to compress the range of stereoscopic disparities so that they lie within a judiciously enlarged fusional area, such as that proposed by Williams and Parrish. A method for doing this is described in the next two sections.
Before going on, we must consider another potential problem. We should be aware that tampering with stereoscopic depth may cause us to misjudge distance. There is conflicting evidence as to whether this is likely. Some studies have shown stereoscopic disparity to be relatively unimportant in making absolute depth judgments. Using a special apparatus, Wallach and Karsh (1963) found that when they rotated a wireframe cube viewed in stereo, only half of the subjects were even aware of a doubling in their eye separation. Because increasing eye separation increases stereo disparities, this should have resulted in a grossly distorted cube. The fact that distortion was not perceived indicates that kinetic depth-effect information and rigidity assumptions are much stronger than stereo information. Ogle (1962) argued that stereopsis gives us information about the relative depths of objects that have small disparities especially when they are close together. When it comes to judging the overall layout of objects in space, other depth cues dominate. Also, many experiments show large individual differences in how we use the different kinds of depth information, so we will never have a simple one-size-fits-all account.
Overall, we can conclude that the brain is very flexible in weighing evidence from the different depth cues and that disparity information can be scaled by the brain depending on other available information. Therefore, it should be possible to artificially manipulate the overall pattern of stereo disparities and enhance local 3D space perception without distorting the overall sense of space, if other strong cues to depth, such as linear perspective, are provided. We (Ware et al., 1998) investigated dynamically changed disparities by smoothly varying the stereoscopic eye separation parameter. We found that a subject’s disparity range could be changed by about 30% over a 2-second interval, without him or her even noticing, as long as the change was smooth.
[G7.8] When creating stereoscopic displays for 3D visualizations, adjust the virtual eye separation to optimize perceived stereoscopic depth while minimizing diplopia.
Cyclopean Scale
One simple method that we developed to deal with diplopia problems is called a cyclopean scale (Ware et al., 1998). As illustrated in Figure 7.26, this manipulation involves scaling the virtual environment about the midpoint between the observer’s estimated eye positions (where the Cyclops of mythology had his one eye). The scaling variable is chosen so that the nearest part of the scene comes to a point just behind the monitor screen. To understand the effects of this operation, consider first that scaling a virtual world about a single viewpoint does not result in any change in computer graphics imagery (assuming depth of focus is not taken into account). Thus, the cyclopean scale does not change the overall sizes of objects as they are represented on a computer screen. It does change disparities, though. The cyclopean scale has a number of benefits for stereo viewing: More distant objects, which would normally not benefit from stereo viewing because they are beyond the range where significant disparities exist, are brought into a position where usable disparities are present. The vergence–focus discrepancy is reduced. At least for the part of the virtual object that lies close to the screen, there is no vergence–focus conflict. Virtual objects that are closer to the observer than to the screen are also scaled so they lie behind the screen. This removes the possibility of frame cancellation.

Figure 7.26 Cyclopean scale: A virtual environment is resized around a center point, midway between the left and right viewpoints.
Virtual Eye Separation
The cyclopean scale, although useful, does not remove the possibility of disparities that result in diplopia. In order to do so, it is necessary to compress or expand the disparity range. To understand how this can be accomplished, it is useful to consider a device called a telestereoscope (Figure 7.27). A telestereoscope is generally used to increase disparities when distant objects are viewed, but the same principle can also be used to decrease the range of disparities by optically moving the eyes closer together. Figure 7.28 illustrates the concept of virtual eye separation and demonstrates how the apparent depth of an object decreases if the virtual viewpoints have a wider eye separation than the actual viewpoint. We consider only a single point in the virtual space. If Ev is the virtual eye separation and Ea is the actual eye separation of an observer, the relationship between depth in the virtual image (Zv ) and in the viewed stereo image (Zs ) is a ratio:
 (7.1)
(7.1)
where Ze represents the distance to the screen. By rearranging terms, we can get the stereo depth expressed as a function of the virtual depth and the virtual eye separation:
 (7.2)
(7.2)
Stereoscopic depth can just as easily be increased. If the virtual eye separation is smaller than the actual eye separation, stereo depth is decreased. If the virtual eye separation is larger than the actual eye separation, stereo depth is increased. Ev = Ea for “correct” stereoscopic viewing of a virtual scene, although for the reasons stated this may not be useful in practice. When Ev = 0.0, both eyes get the same image, as in single viewpoint graphics. Note that stereo depth and perceived depth are not always equal. The brain is an imperfect processor of stereo information, and other depth cues may be much more important in determining the perceived depth. Experimental evidence shows that subjects given control of their eye-separation parameters have no idea what the “correct” setting should be (Ware et al., 1998). When asked to adjust the virtual eye-separation parameter, subjects tended to decrease the eye separation for scenes in which there was a lot of depth, but actually increased eye separation beyond the normal (enhancing the sensation of stereoscopic depth) when the scene was flat. This behavior can be mimicked by an algorithm designed to test automatically the depth range in a virtual environment and adjust the eye-separation parameters appropriately (after cyclopean scale). We have found the following function to work well for a large variety of digital terrain models. It uses the ratio of the nearest point to the farthest point in the scene to calculate the virtual eye separation in centimeters.
 (7.3)
(7.3)
This function increases the eye separation to 7.5 cm for shallow scenes (as compared to a normal value of 6.4 cm) and reduces it to 2.5 cm for very deep scenes.
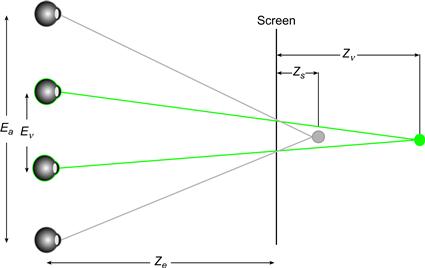
Figure 7.28 The geometry of virtual eye separation. In this example, the stereoscopic depth is decreased by computing an image with a virtual eye separation that is smaller than the actual eye separation.
Artificial Spatial Cues
There are effective ways to provide information about space that are not based directly on the way information is provided in the normal environment, although the best methods are probably effective because they make use of existing perceptual mechanisms. One common technique used to enhance 3D scatterplots is illustrated in Figure 7.29. A line is dropped from each data point to the ground plane. Without these lines, only a 2D judgment of spatial layout is possible. With the lines, it is possible to estimate 3D position. Kim et al. (1991) showed that this artificial spatial cue can be at least as effective as stereopsis in providing 3D position information. It should be understood that, although the vertical line segments in Figure 7.29 can be considered artificial additions to the plot, there is nothing artificial about the way they operate as depth cues. Gibson (1986) pointed out that one of the most effective ways to estimate the sizes of objects is with reference to the ground plane. Adding the vertical lines creates a link to the ground plane and the rich texture size and linear perspective cues embedded in it. In this respect, drop lines function in the same way as cast shadows, but they are generally easier to interpret and should result in more accurate judgments, given that cast shadows can be confusing with certain lighting directions.

Figure 7.29 Dropping lines to a ground plane is an effective artificial spatial cue.
[G7.9] In 3D data visualizations where a strong, preferably gridded, ground plane is available, consider using drop lines to add depth information for small numbers of discrete isolated objects.
Sometimes in computer graphics, foreground objects and objects behind them have the same color, causing them to visually fuse, which nullifies the occlusion cue. A technique has been developed that artificially enhances occlusion by putting a halo along the occluding edges of the foreground objects (see Figure 7.30). Perception of occlusion relies on edge contrast and the continuity of an overlaying contour, and this depends on neural mechanisms for edge detection, but artificial enhancement can amplify these factors to a degree that rarely if ever occurs in nature.
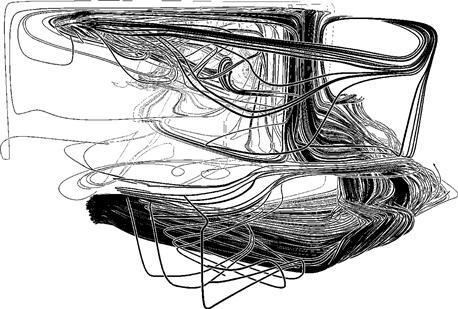
Figure 7.30 This figure shows a set of streamlines for airflow around a room. The principal depth cue is occlusion. The occlusion cue has been artificially enhanced by “halos” in the form of white borders on the black streamlines. From Everts et al. (2009). Reproduced with permission.
[G7.10] In 3D data visualizations, consider using halos to enhance occlusion where this is an important depth cue and where overlapping objects have the same color or minimal luminance difference.
Computer graphics systems sometimes provide a function to implement what researchers call proximity luminance covariance (Dosher et al., 1986). This function is confusingly called depth cueing in computer graphics texts. Depth cueing in computer graphics is the ability to vary the color of an object depending on its distance from the viewpoint, as illustrated in Figure 7.31. Normally, more distant objects are faded toward the background color, becoming darker if the background is dark and lighter if the background is light.
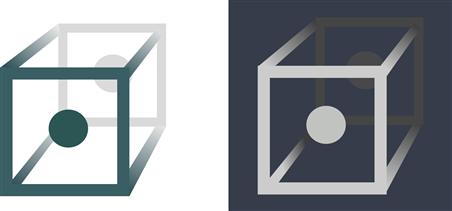
Figure 7.31 Proximity luminance contrast covariance as a depth cue. The contrast with the background is reduced with distance. This simulates extreme atmospheric effects.
This cue is better named proximity luminance contrast covariance, because it is contrast, not luminance, that produces the depth impression. Proximity contrast covariance simulates an environmental depth cue sometimes called atmospheric depth. This refers to the reduction in contrast of distant objects in the environment, especially under hazy viewing conditions. The depth cueing used in computer graphics is generally much more extreme than any atmospheric effects that occur in nature, and for this reason it can be considered an “artificial” cue. Dosher et al. (1986) showed that contrast covariance could function as an effective depth cue but was weaker than stereo for static displays.
Depth Cues in Combination
In designing a visualization, the designer has considerable freedom to choose which depth cues to include and which to leave out. One might think it best to simply include all the cues, just to be sure, but in fact this is not the best solution in most cases. There can be considerable costs associated with creating a stereoscopic display, for example, or with using real-time animation to take advantage of structure-from-motion cues. The hardware is more expensive, and a more complex user interface must be provided. Some cues, such as depth-of-focus information, are difficult or impossible to compute in the general case, because without knowing what object the observer is looking at, it is impossible to determine what should be shown in focus and what should be shown out of focus. A general theory of space perception should make it possible to determine which depth cues are likely to be most valuable. Such a theory would provide information about the relative values of different depth cues when they are used in combination.
Unfortunately, there is no single, widely accepted unifying theory of space perception, although the issue of how depth cues interact has been addressed by a number of studies; for example, the weighted-average model assumes that depth perception is a weighted linear sum of the depth cues available in a display (Bruno & Cutting, 1988). Alternatively, depth cues may combine in a geometric sum (Dosher et al., 1986). Young et al. (1993) proposed that depth cues are combined additively but are weighted according to their apparent reliability in the context of other cues and relevant information. There is also evidence that some depth cues—in particular, occlusion—work in a logical binary fashion rather than contributing to an arithmetic or geometric sum. For example, if one object overlaps another in the visual image, it is perceived as closer to the observer regardless of what the other cues indicate.
Most of the work on spatial information implicitly contains the notion that all spatial information is combined into a single cognitive model of the 3D environment and that this model is used as a resource in performing all spatial tasks. This theoretical position is illustrated in Figure 7.32. Evidence is accumulating, however, that this unified model of cognitive space is fundamentally flawed.
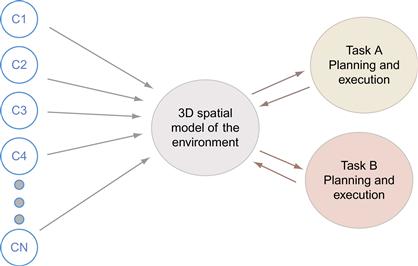
Figure 7.32 Most models of 3D space perception assume that depth cues (C1, …, CN) feed into a cognitive 3D model of the environment. This, in turn, is used as a resource in task planning and execution.
The alternative theory that is emerging is that depth cues are combined expeditiously, depending on task requirements (Jacobs & Fine 1999; Bradshaw et al., 2000); for example, Wanger et al. (1992) showed that cast shadows and motion parallax cues both helped in the task of orienting one virtual object to match another. Correct linear perspective (as opposed to parallel orthographic perspective) actually increased errors; it acted as a kind of negative depth cue for this particular task. With a different task, that of translating an object, linear perspective was found to be the most useful of the cues, and motion parallax did not help at all. Further, Bradshaw et al. (2000) showed that stereopsis is critical in setting objects at the same distance from the observer, but motion parallax is more important for a layout task involving the creation of a triangle laid out in depth.
This alternative task-based model of depth perception is illustrated in Figure 7.33. It does not assume an internal cognitive 3D model of the environment. Instead, cues are combined with different weightings depending on the task. Whatever the task (for example, threading a needle or running through a forest), certain depth cues are informative and other cues can be irrelevant.
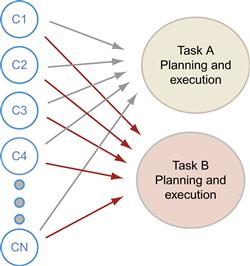
Figure 7.33 Experimental evidence suggests that depth cues (C1, …, CN) are weighted very differently for different tasks, suggesting that there is no unified cognitive spatial model.
An application designer’s choice is not whether to design a 3D or 2D interface, but rather which depth cues to use to best support a particular set of tasks. Depth cues can be applied somewhat independently. In a static picture, for example, we use all of the monocular pictorial depth cues, but not motion parallax or stereoscopic disparity. If we add structure-from-motion information, we get what we see at the movie theater. If we add stereo to a static picture, the result is the kind of stereoscopic viewer popular in Victorian times. We can also use far fewer depth cues. Modern desktop GUIs only use occlusion for windows, some minor shading information to make the menus and buttons stand out, and a cast shadow for the cursor.
There are some restrictions on our freedom to arbitrarily choose combinations of depth cues because some cues depend on the correct implementation of other cues. Figure 7.34 shows a dependency graph for depth cues. An arrow means that a particular cue depends on another cue to appear correctly. This graph does not show absolute rules that cannot be broken, but it does imply that breaking the rules will have undesirable consequences; for example, the graph shows that kinetic depth depends on correct perspective. It is possible to break this rule and show kinetic depth with a parallel (orthographic) perspective. The undesirable consequence is that a rotating object will appear to distort as it rotates. This graph is transitive; all of the depth cues depend on occlusion being shown properly, because they all depend on something that in turn depends on occlusion. Occlusion is, in a sense, the most basic depth cue; it is difficult to break the occlusion dependency rule and have a perceptually coherent scene.

Figure 7.34 A dependency graph for depth cues. Arrows indicate how depth cues depend on each other for undistorted appearance.
[G7.11] In 3D data visualizations, understand and use the depth cues that are most important for the critical tasks in an application. Implement other cues on which these critical cues depend.
Task-Based Space Perception
The obvious advantage of a theory of space perception that takes the task into account is that it can be directly applied to the design of interactive 3D information displays. The difficulty is that the number of tasks is potentially large, and many tasks that appear at first sight to be simple and unified are found, upon more detailed examination, to be multifaceted. Nevertheless, taking the task into account is essential; perception and action are intertwined. If we are to understand space perception, we must understand the purpose of perceiving.
The best hope for progress lies in identifying a small number of elementary tasks requiring depth perception that are as generic as possible. If the particular set of spatial cues associated with each task can be characterized, then the results can be used to construct design guidelines. The remainder of this chapter is devoted to analyzing the following tasks:
• Judging the morphology of surfaces
• Finding patterns of points in 3D space
• Finding shapes of 3D trajectories
• Judging the relative positions of objects in space
• Judging the relative movements of self within the environment
This list of nine tasks is at best only a beginning; each has many variations, and none turns out to be particularly simple in perceptual terms.
Tracing Data Paths in 3D Graphs
Many kinds of information structures can be represented as networks of nodes and arcs, technically called graphs. Figure 7.35 shows an example of object-oriented computer software represented using a 3D graph. Nodes in the graph stand for various kinds of entities, such as modules, classes, variables, and methods. The 3D spars that connect the entities represent various kinds of relationships characteristic of object-oriented software, such as inheritance, function calls, and variable usage. Information structures are becoming so complex that there has been considerable interest in the question of whether a 3D visualization will reveal more information than a 2D visualization. Is it a good idea?
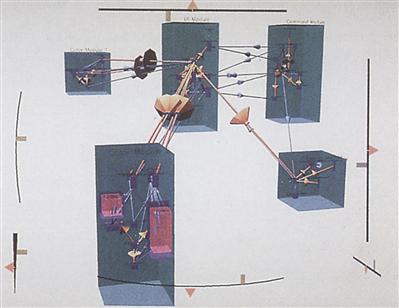
Figure 7.35 The structure of object-oriented software code is represented as a graph in 3D.
One special kind of graph is a tree. Trees are a standard technique for representing hierarchical information, such as organizational charts or the structure of information in a computer directory. The cone tree is a graphical technique for representing tree-graph information in 3D (Robertson et al., 1993). It shows the tree branches arranged around a series of circles, as illustrated in Figure 7.36. The inventors of the cone tree claim that as many as 1000 nodes may be displayed without visual clutter using cone trees, clearly more than could be contained in a 2D layout; however, with a cone tree, we do not see all 1000 nodes at a time, as some are hidden and parts of the tree must be rotated to reveal them. In addition, 3D cone trees require more complex and time-consuming user interactions to access nodes than are necessary for 2D layouts, so the task of tracing out a path will take longer to perform. Other 2D methods such as the hyperbolic tree (Lamping et al., 1995) have proven to be more efficient.
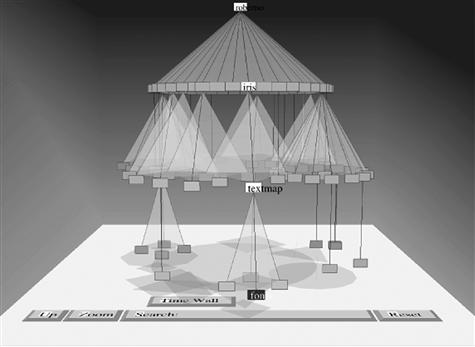
Figure 7.36 The cone tree invented by Robertson et al. (1993).
Empirical evidence shows that the number of errors in detecting paths in 3D tree structures is substantially reduced if stereoscopic and motion depth cues are used. Sollenberger and Milgram (1993) investigated a task involving two 3D trees with intermeshed branches. The task was to discover to which of two tree roots a highlighted leaf was attached. Subjects carried out the task both with and without stereo depth, and with and without rotation to provide kinetic depth. Their results showed that both stereo and kinetic depth viewing reduced errors, but that kinetic depth was the more potent cue. However, an abstract tree structure is not necessarily a good candidate for 3D visualization, for the reason that a tree data structure can always be laid out on a 2D plane in such a way that none of the paths cross (path crossings are the main reason for errors in path-tracing tasks), so creating a 2D visualization is easy for trees.
Unlike trees, more general node–link structures, such as directed acyclic graphs, usually cannot be laid on a plane without some links crossing and these are a better test of whether 3D viewing allows more information to be seen. To study the effects of stereo and kinetic depth cues on 3D visualization of complex node–link structures, we systematically varied the size of a graph laid out in 3D and measured path-tracing ability with both stereoscopic and motion depth cues (Ware & Franck, 1996). Our results, illustrated in Figure 7.37, showed a factor of l.6 increase in the complexity that could be viewed when stereo was added to a static display, but a factor of 2.2 improvement when kinetic depth cues were added. A factor of 3.0 improvement occurred with both stereo and kinetic depth cues. These results held for a wide range of graph sizes. A subsequent experiment showed that the advantage of kinetic depth cues applied whether the motion was coupled to movements of the head or movements of the hand or consisted of automatic oscillatory rotation of the graph.

Figure 7.37 The plot shows that errors increased when the number of nodes increased, with and without stereo and/or motion parallax. The task involved tracing paths in a 3D graph (Ware & Franck, 1996).
Having a higher resolution screen can increase the benefit of stereo and motion cues. We found an order of magnitude benefit to 3D viewing using an ultra-high-resolution stereoscopic display and found that subjects were rapidly and accurately able to resolve paths in graphs with more than 300 nodes (Ware & Mitchell, 2008).
Occlusion is one additional depth cue that should make it easier to differentiate links in 3D graphs, but if all the links are uniformly colored the depth ordering will not be visible. Coloring the links differently or using halos like those shown in Figure 7.30 should help (Telea & Ersoy, 2010).
It seems unlikely that other depth cues will contribute much to a path-tracing task. There is no obvious reason to expect perspective viewing to aid the comprehension of connections between nodes in a 3D graph, and this was confirmed empirically by our study (Ware & Franck, 1996). There is also no reason to suppose that shading and cast shadows would provide any significant advantage in a task involving connectivity, although shading might help in revealing the orientation of the arcs.
[G7.12] When it is critical to perceive large 3D node–link structures, consider using motion parallax, stereoscopic viewing, and halos.
Still, interacting with nodes is a common requirement for graph-based visualization; often nodes must be selected to get related information. This is usually more difficult and costly with a 3D interface, making 2D network visualization methods a better choice. An alternative to 3D viewing is to use 2D interaction techniques to gain access to larger graphs. We consider these alternatives in Chapter 10.
Judging the Morphology of Surfaces
From a Gibsonian point of view, the obvious way to represent a univariate map is to make it into a physical surface in the environment. Some researchers occasionally do just this; they construct plaster or foam models of data surfaces. But, the next best thing may be to use computer graphics techniques to shade the data surface with a simulated light source and give it a simulated color and texture to make it look like a real physical surface. Such a simulated surface can be viewed using a stereoscopic viewing apparatus, by creating different perspective images, one for each eye. These techniques have become so successful that the auto industry is using them to design car bodies in place of the full-size clay models that were once constructed by hand to show the curves of a design. The results have been huge cost savings and a considerably accelerated design process.
Four principal sets of visual cues for surface shape perception have been studied: shading models, surface texture, stereoscopic depth, and motion parallax. To determine which of these are the most effective, Norman et al. (1995) used computer graphics to render smoothly shaded rounded objects under various viewing conditions both with and without texture. They manipulated the entire list of variables given above—specular shading, Lambertian shading, texture, stereo, and motion parallax—in a multifactor experiment. Stereo and motion were studied only in combination with the other cues, because without shading or texture neither stereo nor motion cues can be effective.
Norman et al. (1995) found all of the cues they studied to be useful in perceiving surface orientation, but the relative importance of the cues differed from one subject to another. For some subjects, motion appeared to be the stronger cue; for others, stereo was stronger. A summary of their results with motion and stereo data combined is given in Figure 7.38. Motion and stereo both reduced errors dramatically when used in combination with any of the surface representations. Overall, the combination of shading (either specular or Lambertian) with either stereo or motion was either the best or nearly the best combination for all the subjects.

Figure 7.38 Results of the study of shape perception by Norman et al. (1995). The average errors in adjusted orientation are shown for five different surface representations. The different representations are labeled as follows: (L) Lambertian shading, (S) specular highlight shading, (T) texture with no shading, (L + T) Lambertian shading with texture, and (L + S) Lambertian shading with specular highlights. The four sets of histograms represent results from four different subjects.
There have been other studies of the relative importance of different cues to the perception of surface shape. Todd and Mingolla (1983) found surface texture to be more effective in determining surface shape than either Lambertian shading or specular shading; however, because of the lack of a convincing general theory for the combination of spatial cues, it is difficult to generalize from experiments such as this. Many of the results may be valid only for specific textures conforming to a surface in a particular way (Kim et al., 1993; Interrante et al., 1997). For these reasons, it is not meaningful to make general statements such as, “Lambertian shading is more useful than texture.” The values of the different cues will also depend on the nature of the surface features that are important and the particular texture used.
Conformal Textures
The boundary contours of objects can interact with surface shading to change dramatically the perception of surface shape. Figure 7.39 is adapted from Ramachandran (1988). It shows two shapes that have exactly the same shading but different silhouette contours. The combination of silhouette contour information with shading information is convincing in both cases, but the surface shapes that are perceived are very different. This tells us that shape-from-shading information is inherently ambiguous; it can be interpreted in different ways, depending on the contours.
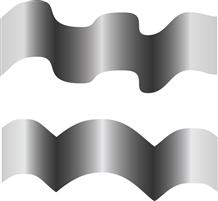
Figure 7.39 When scanned from left to right, the sequences of gray values in these two patterns are identical. The external contour interacts with the shading information to produce the perception of two very differently shaped surfaces. Redrawn from Ramachandran (1988).
Contours that are drawn on a shaded surface can also drastically alter the perceived shape of that surface. Figure 7.40 has added shaded bands that provide internal contour information. As in Figure 7.39, the actual pattern of shading within each of the two images is the same. It is the contour information that makes one surface shape appear so different from the other. This technique can be used directly in displaying shaded surfaces to make a shape easier to perceive.

Figure 7.40 The left-to-right gray sequences in these patterns are identical. The internal contours interact with the shading information to produce the perception of two very differently shaped surfaces.
One of the most common ways to represent surfaces is to use a contour map. A contour map is a plan view representation of a surface with isoheight contours, usually spaced at regular intervals. Conceptually, each contour can be thought of as the line of intersection of a horizontal plane with a particular value in a scalar height field, as illustrated in Figure 7.41. Although reading contour maps is a skill that requires practice and experience, contour maps should not necessarily be regarded as entirely arbitrary graphical conventions. Contours are visually ambiguous with respect to such things as direction of slope; this information is given only in the printed labels that are attached to them. However, it is likely that the contours in contour maps get at least some of their expressive power because they provide perceptual shape and depth cues. As we have seen, both occluding (silhouette) contours and surface contours are effective in providing shape information. Contours provide a form of conformal texture, giving both shape and slope information. Contour maps are a good example of a hybrid code; they make use of a perceptual mechanism, and they are partly conventional. The combination of contours with shading can be especially effective (Figure 7.42).
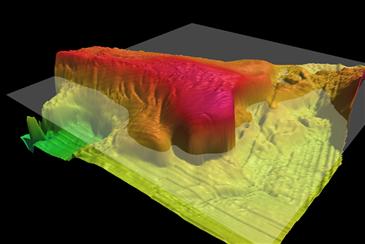
Figure 7.41 A contour is created by the intersection of a plane with a scalar field.
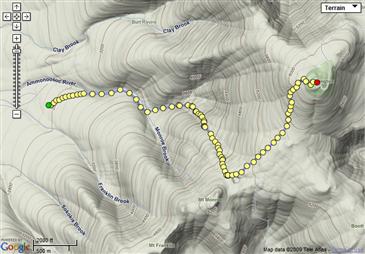
Figure 7.42 Shading provides the overall shape of the topography, but the contours provide both precise height information and supplementary shape and gradient information. From Google. With permission.
Texturing surfaces is important when they are viewed stereoscopically. This becomes obvious if we consider that a uniform nontextured polygon contains no internal stereoscopic information about the surface it represents. Under uniform lighting conditions, such a surface also contains no orientation information. When a polygon is textured, every texture element provides stereoscopic depth information relative to neighboring points. Figure 7.43 shows a stereoscopic pair of images representing a textured surface. Stereoscopic viewing also considerably enhances our ability to see one surface through another, semitransparent, one (Interrante et al., 1997; Bair et al., 2009).
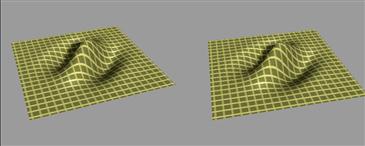
Figure 7.43 Texture is important in stereo viewing because it provides high-resolution disparity gradients, which in turn provide essential information to the disparity-sensing mechanisms of the visual cortex.
Guidelines for Displaying Surfaces
Taken together, the evidence suggests that to represent a surface clearly it may be possible to do better than simply creating a photorealistic rendering of a scene using the most sophisticated techniques of computer graphics. A simplified lighting model—for example, a single light source located at infinity—may be more effective than complex rendering using multiple light sources. The importance of contours and the easy recognizability of cartoon representation suggest that an image may be enhanced for display purposes by using techniques that are nonrealistic. Taking all these caveats into consideration, some guidelines may be useful for the typical case (the first four are restatements of G2.1, G2.2, G2.3, and G2.4 given in Chapter 2): [G2.1] A simple lighting model, based on a single light source applied to a Lambertian surface, is a good default. The light source should be from above and to one side and infinitely distant. [G2.2] Specular reflection is especially useful in revealing fine surface detail. Because specular reflection depends on both the viewpoint and the position of the light source, the user should be given interactive control of both the lighting direction and the amount of specular reflection to specify where the highlights will appear. [G2.3] Cast shadows should be used, but only if the shadows do not interfere with other displayed information. The shadows should be computed to have blurred edges to make a clear distinction between shadow and surface pigment changes. [G2.4] Both Lambertian and moderate specular surface reflection should be modeled. More sophisticated lighting modeling, such as using the radiosity method, may help in the perception of occlusion and be useful in cases where other cues provide weak information.
[G7.13] Consider using textures to help reveal surface shapes, especially if they are to be viewed in stereo. This is only appropriate for relatively smooth surfaces and where texture is not needed for some other attribute. Ideally, texturing should be low contrast so as not to interfere with shading information. Textures that have linear components are more likely to reveal surface shape than textures with randomly stippled patterns. When one 3D surface is viewed over another, the top surface should have lacy, see-through textures.
[G7.14] Consider using both structure-from-motion (by rotating the surface) and stereoscopic viewing to enhance the user’s understanding of 3D shape in a 3D visualization. These cues will be especially useful when one textured transparent surface overlays another.
There are also temporal factors to be considered if viewing times are brief. When we are viewing stereoscopic displays, it can take several seconds for the impression of depth to build up. However, stereoscopic depth and structure-from-motion information interact strongly. With moving stereoscopic displays, the time to fusion can be considerably shortened (Patterson & Martin, 1992). In determining the shape of surfaces made from random dot patterns, using both stereoscopic and motion depth cues, Uomori and Nishida (1994) found that kinetic depth information dominated the initial perception of surface shape, but after an interval of 4 to 6 seconds, stereoscopic depth came to dominate.
Bivariate Maps—Lighting and Surface Color
In many cases, it is desirable to represent more than one continuous variable over a plane. This representation is called a bivariate or multivariate map. From the ecological optics perspective discussed in Chapter 1, the obvious bivariate map solution is to represent one of the variables as a shaded surface and the other as color coding on that surface. A third variable might use variations in the surface texture. These are the patterns we have evolved to perceive. An example is given in Figure 7.44, where one variable is a height map of the ocean floor and the surface color represents sonar backscatter strength. In this case, the thing being visualized is actually a physical 3D surface; however, the technique also works when both variables are abstract. A radiation field, for example, can be expressed as a shaded height map, and a temperature field can be represented by the surface color.

Figure 7.44 A bivariate map showing part of the Stellwagen Bank National Marine Sanctuary. One variable shows angular response of sonar backscatter, color coded and draped on the depth information given through shape-from-shading. From Mayer et al. (1997). Courtesy of Larry Mayer.
If this colored and shaded surface technique is used, some obvious tradeoffs must be observed. Because luminance is used to represent shape-from-shading by artificially illuminating the surface, we should minimally use luminance variation in coloring the surface. The surface coloring should be done mainly using the chromatic opponent channels discussed in Chapter 4. But, because of the inability of color to carry high-spatial-frequency information, only relatively gradual changes in color can be perceived; therefore, in designing a multivariate surface display, rapidly changing information should always be mapped to luminance. For a more detailed discussion of these spatial tradeoffs, see Robertson and O’Callaghan (1988), Rogowitz and Treinish (1996), and Chapter 4 of this book.
A similar set of constraints applies to the use of visual texture. Normally, it is advisable to use luminance contrast in displaying texture, but this will also tend to interfere with shape-from-shading information. If we use texture to convey information, we have less available visual bandwidth to express surface shape and surface color. We can gain a relatively clear and easily interpreted trivariate map, but only so long as we do not need to express a great deal of detail. Using color, texture, and shape-from-shading to display different continuous variables does not increase the total amount of information that can be displayed per unit area, but it does allow multiple map variables to be independently perceived.
[G7.15] As a method for displaying bivariate scalar field maps, use a shaded height field for one variable and color coding for the other. This will work best if the shaded variable is relatively smooth.
Patterns of Points in 3D Space
The scatterplot is probably the most effective method for finding unknown patterns in 2D discrete data. When three attributes are given for each data point, one solution is to show it in 3D using depth cues. The attributes are mapped to positions on the x, y, and z axes, respectively. The resulting 3D scatterplot is usually rotated around a vertical axis, exploiting structure-from-motion to reveal its structure (Donoho et al., 1988). This technique can be an alternative to the color- and shape-enhanced scatterplots discussed in Chapters 4 and 5. If needed, color and size can be added to the glyphs of a 3D scatterplot to show even more data attributes. There has been little or no empirical work on the role of depth cues in perceiving structures such as clusters and correlations in 3D. Nevertheless, a number of conclusions can be deduced from our understanding of the way depth cues function.
Only a few depth cues can help with 3D scatterplots. Perspective cues will not help us perceive depth in a 3D scatterplot, because a cloud of small, discrete points has no perspective information. If the points all have a constant and relatively large size, weak depth information will be produced by the size gradient. Similarly, with small points, occlusion will not provide useful depth information, but if the points are larger, some ordinal depth information will be perceivable. If there are a large number of points, cast shadows will not provide information, because it will be impossible to determine the association between a given point and its shadow. Shape-from-shading information will also be missing, because a point has no orientation information. Each point will reflect light equally, no matter where it is placed and no matter where the light source is placed.
It is likely then that the only depth cues in a 3D scatterplot are stereoscopic depth and structure-from-motion. There seems to be little doubt that using both will be advantageous. As with the perception of surfaces, discussed previously, the relative advantages of the different cues will depend on a number of factors. Stereo depth will be optimal for fine depth discriminations between points that lie near one another in depth. Structure-from-motion will be more important for points that lie farther apart in depth.
[G7.16] To see depth in a 3D scatterplot, consider generating structure-from-motion cues by rotating or oscillating the point cloud around a vertical axes. Also use stereoscopic viewing if possible.
One of the problems with visualizing clouds of data points is that the overall shape of the cloud cannot easily be seen, even when stereo and motion cues are provided. One way to add extra shape information to a cloud of discrete points is to add shape-from-shading information artificially. It is possible to treat a cloud of data points as though each point were actually a small, flat, oriented object. These flat particles can be artificially oriented, if they lie near the boundary of the cloud, to reveal the shape of the cloud when shading is applied. In this way, perception of the cloud’s shape can be considerably enhanced, and shape information can be perceived without additional stereo and motion cues. At the same time, the positions of individual points can be perceived. Figure 7.45 illustrates this.
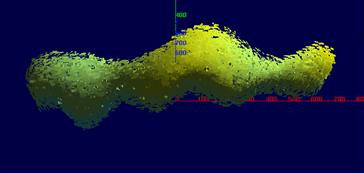
Figure 7.45 A cloud of discrete points is represented by oriented particles. An inverse square law of attraction has been used to determine the point normals. When the cloud is artificially shaded, its shape is revealed (Li, 1997).
[G7.17] If it is important to judge the morphology of the outer boundary of a 3D cloud of points, consider employing a statistical approximation method to estimate the local orientation of the cloud surface and use this to shade the individual points.
Perceiving Patterns in 3D Trajectories
A common problem in geospatial visualization is to understand the path of a particle, animal, or vehicle through space. A simple line rendering only provides 2D information and this is therefore unsuitable. Using motion parallax or stereoscopic viewing will help. Also, periodic drop lines to a ground plane can be used. In addition, rendering the trajectory as a tube or box adds perspective and shape-from-shading cues, especially if rings are drawn around the tube at periodic intervals. An additional advantage of a box trajectory is that it can also convey roll information. Figure 7.46 shows the trajectory of a humpback whale carrying out a bubble-net feeding maneuver (Ware et al., 2006).

Figure 7.46 The trajectory of a humpback whale bubble-net feeding is shown using an extruded box.
[G7.18] To represent 3D trajectories, consider using shaded tube or box extrusions, with periodic bands to provide orientation cues. Also, apply motion parallax and stereoscopic viewing, if possible.
Judging Relative Positions of Objects in Space
Judging the relative positions of objects is a complex task, performed very differently depending on the overall scale and the context. When very fine depth judgments are made in the near vicinity of the viewer, such as are needed to thread a needle, stereopsis is the strongest single cue. Stereoscopic depth perception is a superacuity and is optimally useful for objects held at about arm’s length. For these fine tasks, motion parallax is not very important, as evidenced by the fact that people hold their heads still when threading needles.
In larger environments, stereoscopic depth perception has a minimal role for objects at distances beyond 30 m. Instead, when we are judging the overall layout of objects in a larger environment, known object size, motion parallax, linear perspective, cast shadows, and texture gradients all contribute to our understanding, depending on the exact spatial arrangement.
Gibson (1986) noted that much of size constancy can be explained by a referencing operation with respect to a textured ground plane. The sizes of objects that rest on a uniformly textured ground plane can be obtained by reference to the texture element size. Objects slightly above the ground plane can be related to the ground plane through the shadows they cast. In artificial environments, a very strong artificial reference can be provided by dropping a vertical line to the ground plane.
Because 3D environments can be so diverse and used for so many different purposes, no specific additional guidelines are given here relating to judgments of object position in 3D. The optimal mix is a complex design problem, not something for simple guidelines. All of the depth cues we have been discussing can be applied and should be considered in a design solution.
Judging the Relative Movements of Self within the Environment
When we are navigating through a virtual environment representing an information space, there are a number of frames of reference that may be adopted; for example, an observer may feel she is moving through the environment or that she is stationary and the environment is moving past. In virtual environment systems that are either helmet mounted or monitor based, the user rarely actually physically moves any great distance, because real-world obstacles lie in the way. If self-movement is perceived, it is generally an illusion. Note that this applies only to linear motion, not to rotations; users with helmet-mounted displays can usually turn their heads quite freely.
A sensation of self-movement can be strongly induced when the subject is not moving. This phenomenon, called vection, has been studied extensively. When observers are placed inside a large moving visual field—created either by a physical drum or by means of computer graphics within a virtual-reality helmet—they invariably feel that they are moving, even though they are not. A number of visual parameters, discussed below, influence the amount of vection that is perceived.
Field size—In general, the larger the area of the visual field that is moving, the stronger the experience of self-motion (Howard & Heckman, 1989).
Foreground/background—Much stronger vection is perceived if the moving part of the visual field is perceived as background and more distant from the observer than static foreground objects (Howard & Heckman, 1989). In fact, vection can be perceived even with a quite small moving field, if that field is perceived to be relatively distant. The classic example occurs when someone is sitting in a train stopped at a station and the movement of an adjacent train, seen through a window, causes that person to feel that he or she is moving, even though this is not the case.
Frame—Vection effects are considerably increased if there is a static foreground frame between the observer and the moving background (Howard & Childerson, 1994).
Stereo—Stereoscopic depth can determine whether a moving pattern is perceived as background or foreground, and thereby increase or decrease vection (Lowther & Ware, 1996).
In aircraft simulators and other vehicle simulators, the goal is for the user to experience a sense of self-motion, even though the simulator’s actual physical motion is relatively small or nonexistent.
One of the unfortunate side effects of this perceived motion is simulator sickness. The symptoms of simulator sickness can appear within minutes of exposure to perceived extreme motion. Kennedy et al. (1989) reported that between 10% and 60% of users of immersive displays experienced some symptoms of simulator sickness. This high incidence may ultimately be a major barrier to the adoption of fully immersive display systems.
Simulator sickness is thought to be caused by conflicting cues from the visual system and the vestibular system of the inner ear. When most of the visual field moves, the brain usually interprets this as a result of self-motion. But, if the observer is in a simulator, no corresponding information comes from the vestibular system. According to this theory, the contradictory information results in nausea. There are ways to ensure that simulator sickness does occur and ways of reducing its effects. Turning the head repeatedly while moving in a simulated virtual vehicle is almost certain to induce nausea (DiZio & Lackner, 1992). This means that a virtual ride should never be designed in which the participant is expected to look from side to side while wearing a helmet-mounted display. Simulator sickness in immersive virtual environments can be mitigated by initially restricting the participant’s experience to short periods of exposure, lasting only a few minutes each day. This allows the user to build up a tolerance to the environment, and the periods of exposure can gradually be lengthened (McCauley & Sharkey, 1992).
Selecting and Positioning Objects in 3D
In some interactive 3D visualization environments, users must be able to reach in and manipulate objects, and designers of 3D display systems must make choices about which depth cues to include. In a full-blown virtual-reality system, the usual goal is to include all of the depth cues at the highest fidelity possible, but in practical systems for molecular modeling or 3D computer-aided design, various tradeoffs must be made.
Two of the most important options are whether to use a stereoscopic display and whether to provide motion parallax through perspective coupled to head position. Both require an investment in technology not normally provided with computer workstations. The evidence suggests that, for accurate reaching, having a stereoscopic display is more important than the motion parallax that occurs through the motion of the user’s head (and hence eyes) with respect to the objects being selected (Boritz & Booth, 1998; Arsenault & Ware, 2004).
One of the purposes of tracking head (and eye) position is to get a correct perspective view to support eye–hand coordination. A number of researchers have investigated how eye–hand coordination changes when there is a mismatch between feedback from the visual sense and the proprioceptive sense of body position. A typical experiment involves subjects pointing at targets while wearing prisms that displace the visual image relative to the proprioceptive information from their muscles and joints. Subjects adapt rapidly to the prism displacement and point accurately. Work by Rossetti et al. (1993) suggests that there may be two mechanisms at work: a long-term, slow-acting mechanism that is capable of spatially remapping misaligned systems, and a short-term mechanism that is designed to realign the visual and proprioceptive systems within a fraction of a second. These results have been confirmed in studies with fish-tank virtual-reality systems, showing that a large translational offset between the hand position and the object being manipulated with the hand has only a small effect on performance (Ware & Rose, 1999).
If they are large, rotational mismatches between what is seen and what is held may have a much greater negative impact on eye–hand coordination than translational mismatches. Experiments with prisms that invert the visual field have shown that it can take weeks to reach behavior approaching normal performance under this condition, and adaptation may never be complete (Harris, 1965).
In visually guided hand movement, what seems to be most important is feedback about the relative positions of the graphical object representing the user’s hand (or a probe) and the object itself. The stereoscopic system is exquisitely tuned to depth differences but not to absolute depths. Indeed, one of the main reasons why humans have stereoscopic depth perception is to support visually guided reaching. Research has shown that as long as continuous visual feedback is provided, without excessive lag, people can adjust rapidly to simple changes in the eye–hand relationship (Held et al., 1966).
Getting perfect registration between a user’s hand and a virtual object, as shown in Figure 7.47, is very difficult. This suggests that it is better to show both the hand and object virtually, rather than blend real-world and computer graphics imagery, because in this way it is easy to show the relative positions of the hand and object (see Figure 7.47).

Figure 7.47 If both the hand proxy and the objects are virtual, it is easy to generate the correct relative positions of the hand and object. Courtesy of Siena Robotics and Systems Lab. Permission needed http://sirslab.dii.unisi.it/.
[G7.19] Use stereoscopic viewing when visually guided hand movements are critically important. If possible, use a graphical proxy for the user’s hand and ensure accurate relative positioning between the hand proxy and the virtual objects to be manipulated.
[G7.20] In 3D environments that support one-to-one mapping between the user’s hand and a virtual object, ensure that the relative positions of a hand proxy, such as a probe, and an object being reached for are correct. Also, minimize rotational mismatch (>30 degrees) between the virtual space and the actual space within which the user’s hand is moving.
Actually providing a sense of physical contact with nearby objects is also important in calibrating the proprioceptive system, especially for grasping (Mackenzie & Iberall, 1994). Unfortunately, this component of natural hand–object interaction is proving very difficult to simulate, and, although force feedback devices can provide a sense of contact, they currently have limited capabilities.
Judging the “Up” Direction
In abstract 3D data spaces (for example, molecular models), there is often no sense of an “up” direction, and this can be confusing. In the natural environment, the “up” direction is defined by gravity and sensed by the vestibular system in the inner ear, by the presence of the ground on which we walk, and by oriented objects in our vicinity. Much of the research that has been done on perceived “up” and “down” directions has been done as part of space research, to help us understand how people can best orient themselves in a gravity-free environment. Nemire et al. (1994) showed that linear perspective provides a strong cue in defining objects perceived at the same horizontal level. They showed that a linear grid pattern on the virtual floor and walls of a display strongly influenced what the participants perceived as horizontal; to some extent, this overrode the perception of gravity. Other studies have shown that placing recognizable objects in the scene very strongly influences a person’s sense of self-orientation. The presence of recognizable objects with a known normal orientation with respect to gravity, such as a chair or a standing person, can strongly influence which direction is perceived as up (Howard & Childerson, 1994). Both of these findings can easily be adapted to virtual environments.
[G7.21] To define vertical polarity in a 3D data space, provide a clear reference ground plane and place recognizable objects on it that have a characteristic orientation with respect to gravity.
The Aesthetic Impression of 3D Space (Presence)
One of the most nebulous and ill-defined tasks related to 3D space perception is achieving a sense of presence. What is it that makes a virtual object or a whole environment seem vividly three dimensional? What is it that makes us feel that we are actually present in an environment? Much of presence has to do with a sense of engagement, and not necessarily with visual information. A reader of a powerfully descriptive novel may visualize (to use the word in its original cognitive sense) himself or herself in a world of the author’s imagination—for example, vividly imagining Ahab on the back of the great white whale, Moby-Dick.
Presence might not seem to belong in a task-based classification of spatial information, being usually thought of as an ill-defined aesthetic quality, but in fact a number of practical applications require a sense of presence. For an architect designing a virtual building to present to a client, the feeling of spaciousness and the aesthetic quality of that space may be all-important. In virtual tourism, where the purpose is to give a potential traveler a sensation of what the Brazilian rain forest is really like, presence is also crucial.
A number of studies have used virtual-reality techniques for phobia desensitization. In one study by North et al. (1996), patients who had a fear of open spaces (agoraphobia) were exposed to progressively more challenging virtual open spaces. The technique of progressive desensitization involves taking people closer and closer to the situations that cause them fear. As they overcome their fears at one level of exposure, they can be taken to a slightly more stressful situation. In this way, they can overcome their phobias, one step at a time. The reason for using virtual-reality simulations in phobia desensitization is to provide control over the degree of presence and to reduce the stress level by enabling the patient to exit the stressful environment instantaneously. After treatment in a number of virtual environments, the experimental subjects of North et al. scored lower on a standardized Subjective Units of Discomfort test.
When developing a virtual-reality theme park attraction for Disneyland, Pausch et al. (1996) observed that high frame rate and high level of detail were especially important in creating a sense of presence for users “flying on a magic carpet.” Presenting a stereoscopic display did not enhance the experience. Empirical studies have also shown that high-quality structure-from-motion information contributes more to a sense of presence than does stereoscopic display (Arthur et al., 1993). The sense of presence, however, is not a single unified perceptual dimension. Hendrix and Barfield (1996) found stereoscopic viewing to be very important when subjects were asked to rate the extent to which they felt they could reach for and grasp virtual objects, but it did not contribute at all to the sense of the overall realism of the virtual condition. Hendrix and Barfield did find that having a large field of view was important to creating a sense of presence.
[G7.22] To create a vivid sense of presence in a 3D data space, provide a large field of view, smooth motion, and a lot of visual detail.
Conclusion
High-quality, interactive stereoscopic displays are now inexpensive, although even mediocre-quality virtual-reality systems are still expensive. Creating a 3D visualization environment is considerably more difficult than creating a 2D system with similar capabilities. We still lack design rules for 3D environments, and many interaction techniques are competing for adoption. The strongest argument for the ultimate ascendancy of 3D visualization systems, and 3D user interfaces in general, must be that we live in a 3D world and our brains have evolved to recognize and interact within 3D. The 3D design space is richer than the 2D design space, because a 2D space is a part of 3D space. It is always possible to flatten out part of a 3D display and represent it in 2D.
Nevertheless, it also should be cautioned that going from 2D to 3D adds far less visual information than might be supposed. Consider the following simple argument. On a one-dimensional line of a computer display, we can perceive 1000 distinct pixels. On a 2D plane of the same display, we can display 1000 × 1000 = 1,000,000 pixels, but going to a 3D stereoscopic display only increases the number of pixels by a factor of 2, and this does not double the available information because the two images must be highly correlated for us to perceive stereoscopic depth. We may only be able to stereoscopically fuse images that differ by 10%, usually much less. This suggests a small increase in the amount of information through the use of stereo viewing.
Of all the depth cues, motion parallax is the one most likely to enable us to see more information, but only for certain cognitive tasks. In the case of networks, a network several times larger can be perceived with stereo and motion parallax cues, although even here, if interaction with nodes is critical, interactive 2D methods are likely to be superior. The other depth cues, such as occlusion and linear perspective, certainly help us perceive a coherent 3D space, but as the study of Cockburn and McKenzie (2001) suggests, we should not automatically assume that 3D provides more readily accessible information. Most of the pattern-perception machinery of the visual system operates in 2D, not in 3D, and for this fundamental reason even when a 3D view is being used it is critical to understand what pattern information appears on the 2D image plane.
Deciding whether or not to use a 3D display must involve deciding whether there are sufficient important subtasks for which 3D is clearly beneficial. The complexity and the consistency of the user interface for the whole application must be weighed in the decision. Even if 3D is better for one or two subtasks, the extra cost involved and the need for nonstandard interfaces for the 3D components may suggest that a 2D solution would be better overall. In terms of overall assessment, the cost of navigation is an essential component, and many 3D navigation methods are considerably slower than 2D alternatives. Even if we can show somewhat more information in 3D, the rate of information access may be too slow. In Chapter 10, we shall resume the discussion of the value of 3D versus 2D displays by considering the various costs of interactively acquiring knowledge.